Warning: package 'ggplot2' was built under R version 4.5.2Data Visualization in R Using ggplot2 - Module 2
Show the code
ggplot(data = PlantGrowth,                  # data
       aes(y = weight)) +                         # aesthetics
  geom_boxplot() +                               # geometry
  facet_wrap(~ group) +                       # facets
  stat_summary(aes(x = 0),                  # statistics
               fun = mean,
               geom = "point",
               color = "red",
               size = 3) +
  coord_flip() +                                      # coordinates
  theme_bw()                                        # theme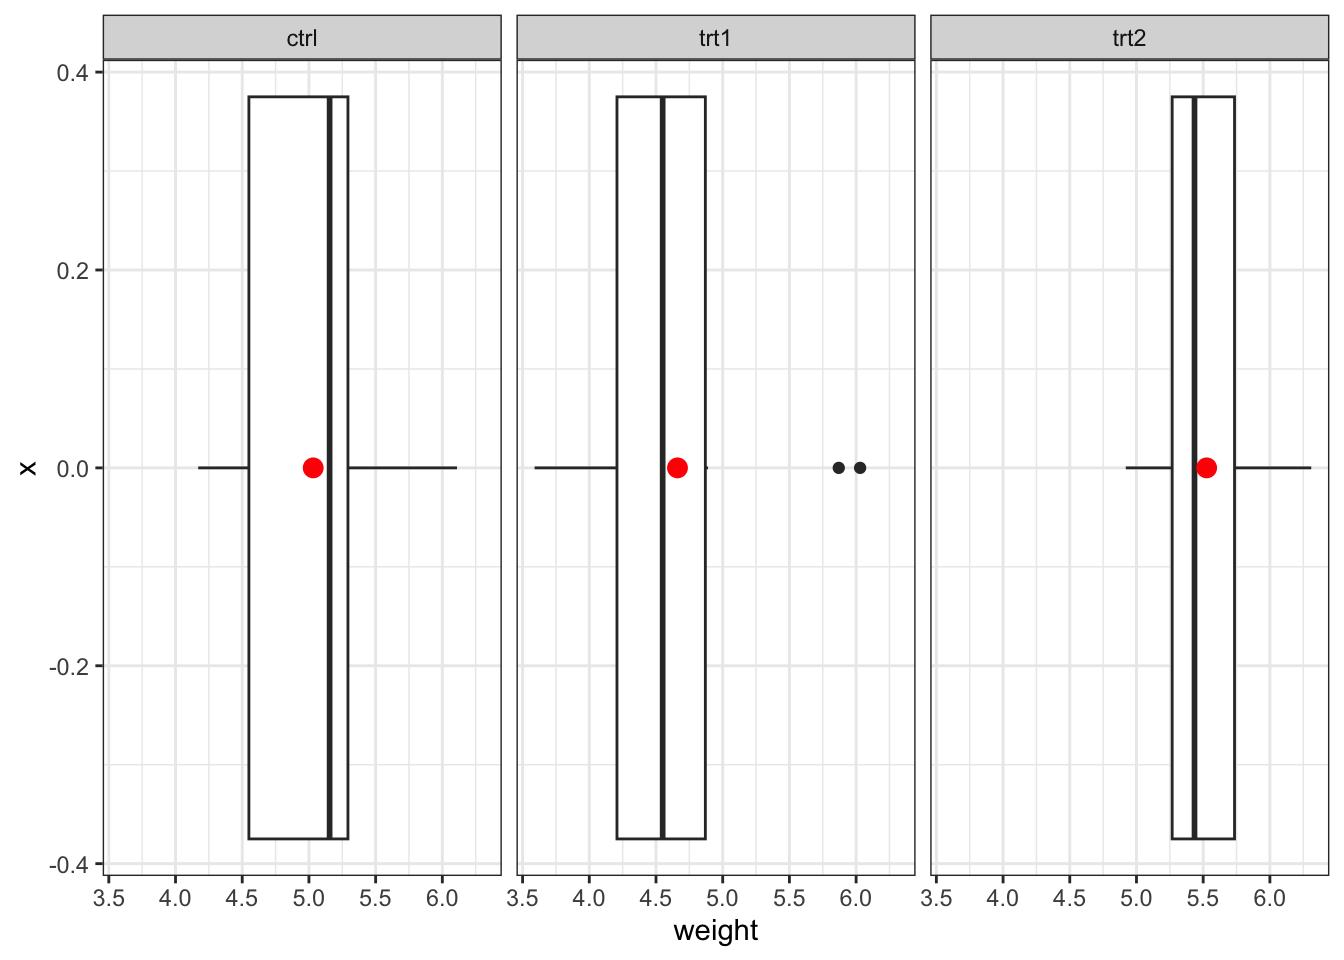
Exercises
Below are the exercises for this module.
- Install and load the ggplot2 package.
- Load the airquality data set using the data() function.
- Draw an empty plot using the ggplot() function, only specifying the data argument with the airquality data set.
- Specify the aes() function within the ggplot() function so that y = Temp, and add a geom_boxplot() layer to draw a boxplot.
- Create a facet boxplot for the Temp column, grouped by the Month column using the facet_wrap() function. How does the temperature distribution vary by month?
- Apply the theme_light() to the facet boxplot you created in the previous exercise.
Show the code
library(ggplot2)
ggplot(data = airquality,
  aes(y = Temp)) +
  geom_boxplot() +
  facet_wrap(~ Month) +
  theme_light()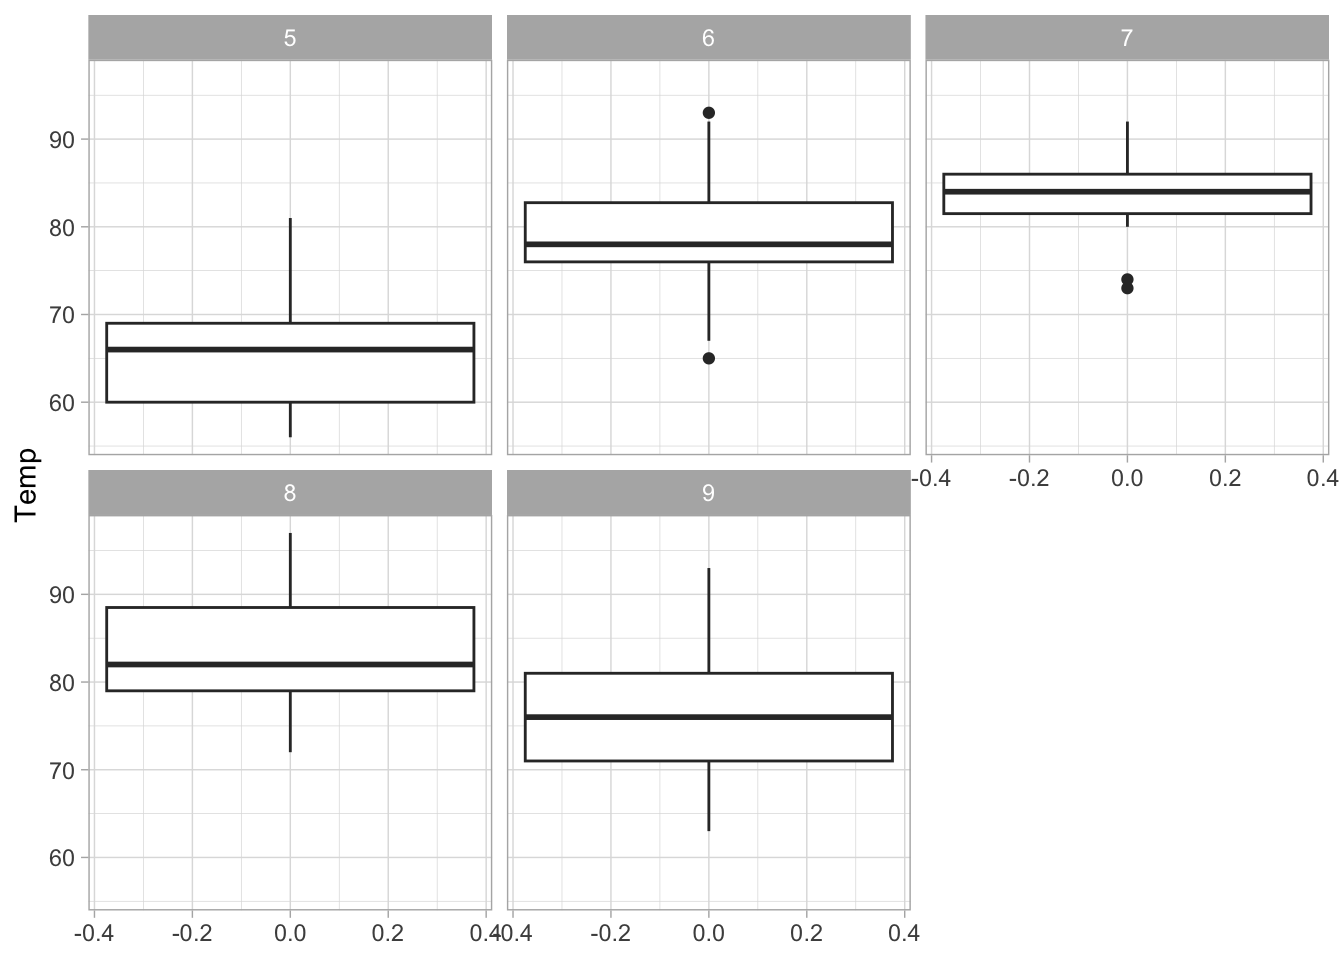
Made with 🧠 and Quarto by Colin Madland.